

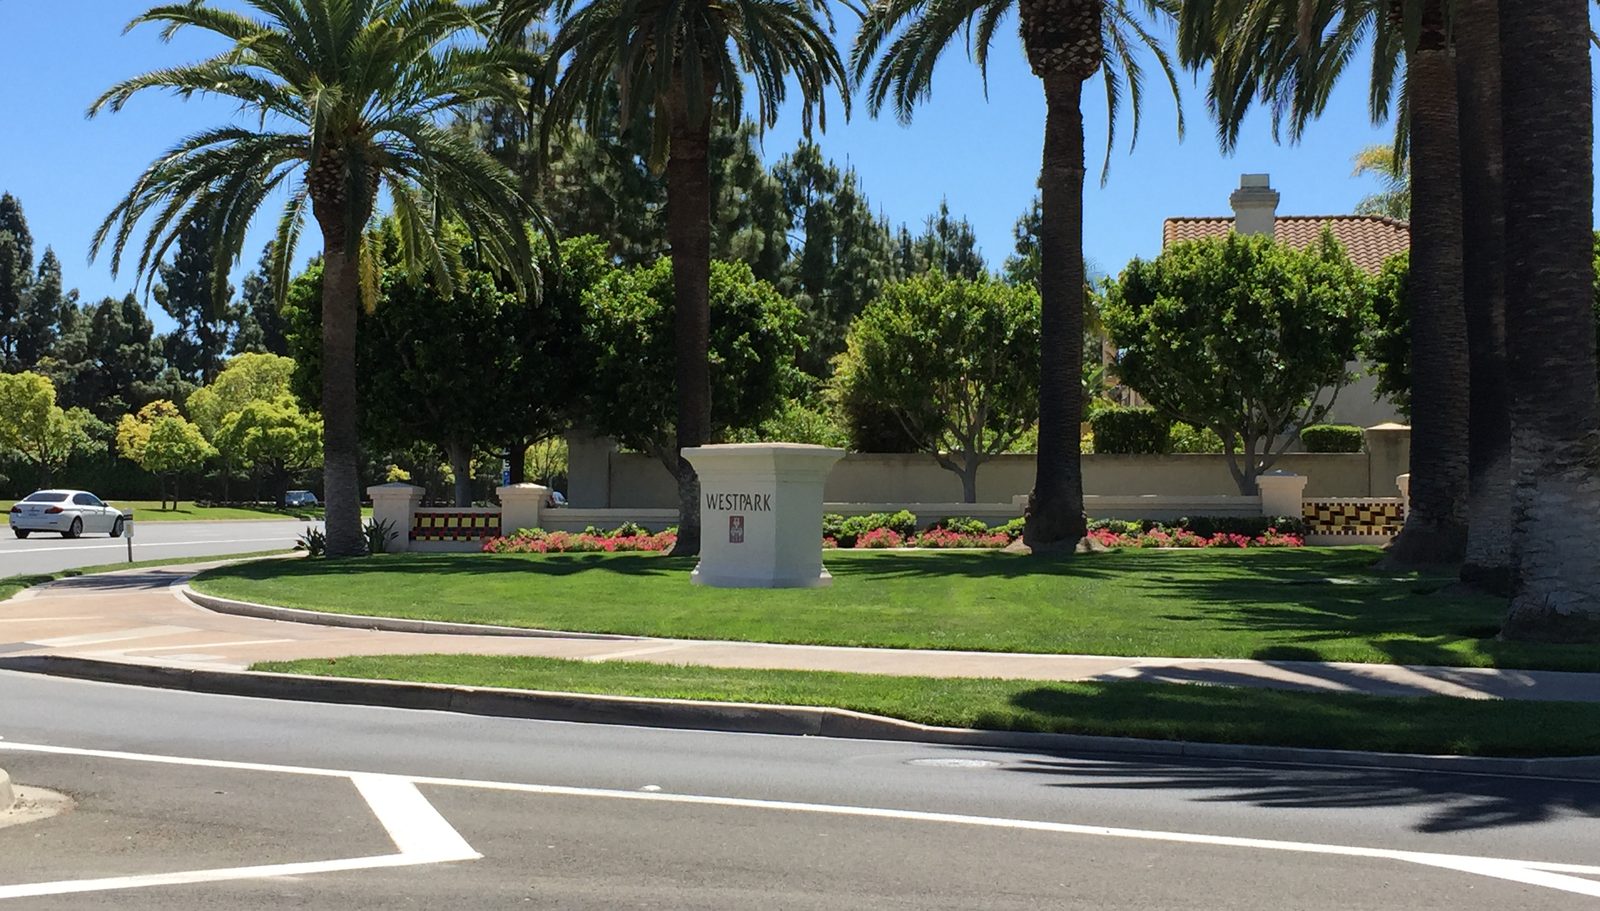
Updated October 11, 2026 with a fresh CRMLS pull. First published August 21, 2026.
Short answer: Moving up inside Westpark in 2026 costs a median of about $730,000. That is the gap between the median condo at $870,000 and the median single family home at $1,600,000. What most buyers miss is that HOA dues go down when you move up: Westpark condos carry a median $399 a month in combined association fees, single family homes just $65. Prices per square foot have eased only about 2.5% in both segments over the past year. What has really changed is speed: the median home took 33 days to sell, up from 12, and only 37% sold at or above asking. Right now the single family side of the market is the softer one, with half of the houses for sale already reduced, which is exactly the side a move-up buyer is buying into.
Every figure on this page comes from CRMLS records for the Westpark area of Irvine, pulled on October 11, 2026, and derived here rather than taken from a portal estimate. The methodology note at the bottom shows the working.
What the Westpark market actually looks like right now
As of October 11, 2026 there are 22 homes actively for sale in Westpark and 8 in escrow. That is a small market, and it is worth saying so plainly, because it changes how you should read every number that follows.
| Condo (incl. townhouse) | Single family | |
|---|---|---|
| Active listings | 10 | 12 |
| In escrow | 6 | 2 |
| Median list price | $949,000 | $1,687,500 |
| Median list price per sq ft | $728 | $856 |
| Median days on market | 48 | 50 |
| Listings reduced below original price | 2 of 10 | 6 of 12 |
| Months of supply | 3.0 | 4.4 |
The split between the two halves of the market matters more than the prices. Six of the 12 single family listings have already been reduced below their original asking price, against 2 of the 10 condos. At the pace of the last 12 months of closings, Westpark holds about 4.4 months of supply of single family homes but only 3.0 months of condos, and 6 of the 8 homes in escrow are condos. Across all 22 listings, 36% have been reduced, by a median of 3.9%.
That is a change from August, when condos were the slow half of the market and houses the fast one. It means a Westpark condo owner who wants to trade up is now selling into the firmer side and buying into the softer side. With only 10 and 12 listings in each group, that balance can tip back within a few weeks, so treat it as the state of play this month, not a trend.
What happened to Westpark prices, and why the headline number misleads
Here is where most neighborhood market write-ups go wrong, including the ones generated from portal data.
Over the last 12 months, the median Westpark closed price was $1,125,000, against $1,280,000 the year before. That is a 12.1% drop, and it would make an alarming headline. It is not a real 12% decline in value. Condos rose from 47.8% of Westpark sales to 54.8%. More condos in the mix pulls the median down whether or not any individual home lost a dollar.
So split the market and lead with price per square foot, which is not distorted by which homes happened to sell.
| Measure | Last 12 months | Prior 12 months | Change |
|---|---|---|---|
| All Westpark | |||
| Closed sales | 73 | 67 | n/a |
| Median price per sq ft | $805 | $866 | -7.0% |
| Median closed price | $1,125,000 | $1,280,000 | -12.1% |
| Median size | 1,377 sq ft | 1,349 sq ft | +2.1% |
| Median days on market | 33 | 12 | +21 days |
| Median sale price vs. final asking price | 98.8% | 99.9% | -1.1 pts |
| Median sale price vs. first asking price | 96.6% | 98.4% | -1.8 pts |
| Closed at or above asking | 37.0% | 49.3% | -12.3 pts |
| Condo (incl. townhouse) | |||
| Closed sales | 40 | 32 | n/a |
| Median price per sq ft | $765 | $786 | -2.7% |
| Median closed price | $870,000 | $888,000 | -2.0% |
| Median size | 1,129 sq ft | 1,107 sq ft | +1.9% |
| Median days on market | 32 | 15 | +17 days |
| Single family | |||
| Closed sales | 33 | 35 | n/a |
| Median price per sq ft | $895 | $918 | -2.5% |
| Median closed price | $1,600,000 | $1,700,000 | -5.9% |
| Median size | 1,988 sq ft | 1,871 sq ft | +6.3% |
| Median days on market | 36 | 10 | +26 days |
Split this way, the picture is much calmer: condos down 2.7% per square foot, single family homes down 2.5%. The all-Westpark figure of -7.0% is mostly the shift toward condos, not a fall in what any one home is worth. The single family median price fell 5.9% while the median home that sold was 6.3% larger, which is another reason to ignore the median price and use price per square foot.
I tested the decline. It is real, and it is small.
A change of 2 to 3% across 33 or 40 sales could easily be noise, so before publishing it I looked tract by tract. Of the 17 Westpark tracts with closings in both years, 12 sold for less per square foot, with a median change of -2.9%. Only four tracts had at least three sales in both years, which is the minimum for a tract median to mean much, and three of those four were lower.
When I first published this guide in August, the same test showed a sharper drop, around 7% for condos. Measured over the latest 12 months, most of that has worked through. Prices are a little below a year ago, not falling. The bigger change for anyone selling is how long it takes and how much room buyers have to negotiate.
Fall is the slow season in Westpark
Days on market in Westpark swing with the calendar, and the pattern has repeated two years running.
| Quarter | Closed sales | Median days on market |
|---|---|---|
| January to March 2025 | 21 | 12 |
| April to June 2025 | 17 | 9 |
| July to September 2025 | 18 | 19 |
| October to December 2025 | 18 | 36 |
| January to March 2026 | 15 | 11 |
| April to June 2026 | 22 | 20 |
| July to September 2026 | 19 | 40 |
Homes sold fast in the spring of both years and slowly in the fall. The 40-day median for July to September 2026 is the slowest quarter in the two years of data, but late 2025 looked much the same and was followed by an 11-day first quarter. If you are planning a move, spring is when Westpark sellers have had the most leverage, and fall is when buyers have.
The move-up gap: what the step from a condo to a house actually costs
This is the calculation most Westpark move-up buyers are trying to make, so here it is in plain numbers, from the last 12 months of closings.
| Median condo | Median single family home | The step | |
|---|---|---|---|
| Closed price | $870,000 | $1,600,000 | +$730,000 |
| Living area | 1,129 sq ft | 1,988 sq ft | +860 sq ft |
| Bedrooms | 2 | 4 | +2 |
| Median combined HOA dues | $399 / month | $65 / month | -$334 / month |
The HOA reversal nobody tells you about
When people move up from a condo to a house they brace for every monthly cost to go up. In Westpark, one of them goes sharply down.
Across all 140 Westpark closings in the past two years, 82% of condos carried a second association fee on top of the primary one. Median primary dues were $345 a month, the median second fee added $54, and the median combined bill was $399 a month. Single family Westpark homes are structured completely differently: median dues of $65 a month, with only 13% carrying a second fee at all.
That is a swing of roughly $334 a month, about $4,000 a year, moving in your favor at exactly the moment your mortgage payment is going up. It will not close a $730,000 gap. But it is a real, recurring number that belongs in your budget, and lenders will count it in your debt-to-income calculation too, which can affect what you qualify for.
It cuts the other way as well. If you are moving up from one condo to a larger one, check the second fee on the target property specifically. It varies across Westpark tracts, and two homes at the same price can carry meaningfully different monthly costs.
Sell first, or buy contingent?
This is the question I hear most often, and in 2026 the data actually points somewhere.
In 2021 and 2022, contingent offers were close to unusable. Sellers had multiple clean offers and no reason to wait on anyone's sale. That is not today's Westpark. Homes are taking a median of 33 days to sell rather than 12, half of the single family homes on the market have already cut their price, and only 37% of closings finished at or above asking, down from 49%. Sellers of Westpark single family homes have measurably more reason to consider a contingent offer than they did a year ago.
Look again at the inventory table, though. This fall the condo side is the tighter one: 3.0 months of supply, few reductions, and most of the homes in escrow. If you are selling a condo to buy a house, you are currently selling into the firmer half of the market and buying into the softer half. That makes selling first less risky than it was in August, and it makes a contingent offer more realistic on a house that has already sat or been reduced.
In practice that usually means one of three structures, and which one fits depends on your equity, your rate, and how distinctive your current home is:
- List first, then shop with a rent-back. Strongest negotiating position on the purchase, and a 30 to 60 day rent-back after closing gives you the bridge. Best when your current home is competitively priced and likely to move quickly, which describes most well-priced Westpark condos right now.
- Buy contingent on your sale. More viable in 2026 than it has been in years, particularly on a single family listing that has been on the market past the 50-day median or has already reduced. Weakest on a fresh, well-priced listing.
- Bridge financing or a non-contingent offer. Strongest offer, highest cost and highest risk. Worth pricing out rather than dismissing, especially given how many sellers are now negotiating.
There is no universally right answer, and anyone who gives you one without looking at your specific home has not done the work. What I do before we decide is run your home against its actual 2026 comparables, estimate a realistic days-on-market range for your tract and property type, and then model the two paths side by side with real numbers.
Pricing your current Westpark home to 2026, not 2022
This is where move-up sellers most often lose money, and the loss compounds: an overpriced listing does not just sell for less, it sells later, which costs you leverage on your purchase at the same time.
Three specifics for Westpark right now:
Anchor to price per square foot, not to a neighbor's sale price. With Westpark closing about six homes a month, any two "comparable" sales can differ by 400 square feet. Per-square-foot pricing against your own tract and property type, adjusted for condition and location, is far more stable than picking the closest recent closing. Never compare a condo's price per square foot with a house's: in Westpark the gap is about $130 a square foot.
Assume a discount from your first asking price. The median Westpark home sold at 98.8% of its final asking price over the past year. Against the price it was first listed at, it sold at 96.6%. That second figure follows each home back through any earlier listing that was cancelled or expired before it was relisted under a new MLS number, and 11% of last year's sales had at least one. If you plan to price high and reduce, 96.6% is the number to build into your net-proceeds estimate.
Time the listing if you can. A Westpark home listed in the fall has been taking three times as long or more to sell as one listed in the first quarter. If you have the flexibility, that difference is worth planning around.
For how Westpark sits against the rest of the city, and which villages are moving faster or slower, the Irvine housing market data hub carries the citywide figures and the village-level breakdown, updated from the same CRMLS source. If you are weighing Westpark against Woodbridge in particular, the Woodbridge housing market data hub gives that village the same treatment, including its own association-dues figures.
For Westpark tract by tract, including price per square foot, HOA dues and the high school each tract's listings report, see my Westpark village page.
What one Westpark seller said
"I read her great reviews and expected a lot from her but was blown away by her attention to detail. … We are not experienced in the processes involved in selling property and really needed someone to hold our hand and guide us through. We couldn't be more happy with the process and the outcome."
Sam Halstead, Westpark condo seller, September 2026, on Google
What to look for when you are buying up
Westpark's housing stock spans condos, townhomes and single family homes, most built between the late 1980s and the late 1990s, all inside planned communities with association-maintained pools, parks and greenbelts. The move-up path here usually takes one of two shapes: trading a condo for a single family home with a private yard and direct garage access, or moving within a type for a better lot, a remodeled interior or a main-floor bedroom.
Four things to check on any Westpark home before you make an offer:
- The full association picture. Ask for the primary dues, any second association fee, and what each one actually covers. As shown above, this varies enormously by tract.
- The property tax bill. Ask for the current bill and check it for any special assessment rather than relying on the listing sheet, where these are recorded inconsistently.
- Per-square-foot pricing against the specific tract. Westpark tracts differ by hundreds of dollars per square foot. A citywide or even village-wide average will mislead you on any individual home.
- How long it has actually been available. A home that was cancelled or expired and then relisted under a new MLS number shows a fresh days-on-market count. 11% of Westpark sales in the past year had an earlier failed listing. Ask for the full listing history: it is negotiating information.
All four are questions about one village rather than one city, which is the whole difficulty of buying here. I wrote about what that kind of expertise looks like in practice, and what to ask an agent to prove it, in choosing the best buyer's agent for Woodbridge Irvine. That piece uses Woodbridge as its worked example, but the questions transfer to Westpark unchanged.
What one Westpark buyer said
"Not only does she have deep historical knowledge about the neighborhoods in Irvine and what is out there, but she's also very on-top of things, and gets the job done. … The most important thing you need in your realtor is trust, and I really trust Debbie."
Jasmine n Sanderson, Westpark condo buyer, July 2026, on Zillow
Frequently asked questions
Is 2026 a good time to move up within Westpark?
For a prepared buyer, the conditions are better than they have been in years. As of October 11, 2026 there are 22 active Westpark listings and 8 in escrow. Half of the 12 single family homes for sale have already reduced their price, and single family supply sits at about 4.4 months, against 3.0 months for condos. Homes closed at or above asking only 37% of the time over the past year, down from 49%. Prices have eased only slightly, so you are not getting a large discount on the purchase, but the negotiating room on the single family side is real, and that matters most when the home you are buying is the expensive one.
How much does it cost to move from a Westpark condo to a Westpark house?
Based on the last 12 months of closed sales, the median Westpark condo sold for $870,000 and the median single family home for $1,600,000, a gap of $730,000 for about 860 more square feet and two more bedrooms. Partly offsetting it, median combined HOA dues fall from about $399 a month on a condo to about $65 on a single family home, a saving of roughly $4,000 a year.
Did Westpark home prices go down in the past year?
Slightly. The overall median closed price fell 12.1%, but most of that reflects a shift in what sold: condos rose from 47.8% to 54.8% of sales. On a per-square-foot basis, which is not distorted by mix, condos fell 2.7% and single family homes fell 2.5%. Tract by tract, 12 of the 17 tracts with sales in both years were lower, by a median of 2.9%.
How long do homes take to sell in Westpark?
Westpark closings over the last 12 months took a median of 33 days on market, up from 12 days the year before. Condos took a median of 32 days, single family homes 36. Timing matters: the median was 40 days for homes that closed between July and September 2026, but only 11 days for the first quarter of the year. Homes currently on the market have been listed a median of about 50 days.
Should I make a contingent offer on my next Westpark home?
It is more viable in 2026 than it has been in years, but it depends on the specific property. With half of the single family listings reduced and only 37% of sales closing at or above asking, many Westpark sellers are open to terms they would have refused two years ago, particularly on homes listed past the 50-day median. A contingency is still weak against a fresh, well-priced listing. The order of operations should be decided against your own home's likely selling speed, not a general rule.
Your next step in Westpark
Moving up in a market this small rewards preparation and punishes guesswork. You need three things before you do anything else: what your current home is realistically worth against 2026 comparables in your own tract, what your target home will actually cost including its association structure, and which transaction order protects you given how fast each side of that trade is moving.
If you are considering a move in Westpark, start with a conversation. I will walk you through what your current home is worth today and what the move-up path looks like for your specific situation, including the numbers behind this page for your tract in particular.
About the author
Debbie Sagorin is a REALTOR® with Coldwell Banker Realty in Irvine, California, working across Westpark, Woodbridge, Oak Creek, Turtle Rock and Woodbury.
Because agent claims are easy to make and hard to check, here is the verifiable version. Over the 24 months ending October 4, 2026, Debbie ranked 9th of 1,788 agents by Irvine listing sides, the top 0.5%. Her listing volume is concentrated in Woodbridge, where she has held more listing sides than any other agent; that concentration is worth knowing when you read any citywide figure. In Westpark specifically, she represented the sellers of a Tiempo condo on Alicante Aisle that closed in September 2026 at 100% of its asking price after 20 days on market, and the buyers of another Tiempo condo on Alicante Aisle in July 2026. All of it is checkable in CRMLS.
Coldwell Banker Realty | CA DRE #01411020 | (949) 537-2079
Data and methodology
All Westpark figures on this page were derived from CRMLS records pulled on October 11, 2026 for the CRMLS area WP - Westpark, which covers ZIP codes 92606 and 92614 and includes the Culverdale tract.
- Closed sales: 140 residential closings from October 17, 2024 through October 6, 2026. "Last 12 months" means closings from October 12, 2025 through October 11, 2026 (73 sales); "prior 12 months" means October 12, 2024 through October 11, 2025 (67 sales).
- Current inventory: 22 active listings and 8 in escrow (4 active under contract, 4 pending) as of October 11, 2026. Months of supply divides active listings by the average monthly closings of the last 12 months.
- Property type follows the MLS sub type. "Condo (incl. townhouse)" combines the Condominium and Townhouse sub types; "single family" is the Single Family Residence sub type. This is the legal form of ownership, not whether the home shares a wall: some Westpark condos are detached and some single family homes are attached.
- Price per square foot is calculated per property as closed price divided by living area, then taken as a median, not as an aggregate. Medians are used throughout rather than averages.
- Days on market is the MLS days-on-market field for the listing that closed.
- Sale price vs. final asking price is closed price divided by the last list price. Sale price vs. first asking price traces each sale back through earlier cancelled, expired or withdrawn listings of the same property (matched by parcel number) when the earlier listing came off the market within 90 days before the next one went on, and uses the original price of the first listing in that chain. 8 of the 73 sales in the last 12 months had at least one earlier failed listing.
- HOA figures combine the primary association fee and any second association fee, both converted to monthly, across all 140 closings. Four records reported quarterly primary dues and were converted.
- Sample size caveat: Westpark closes about six homes a month. Segment medians rest on 32 to 40 sales each, quarterly figures on 15 to 22, and tract-level figures on far fewer. This is why the analysis leads with price per square foot, splits by property type, reports median size alongside every median price, and tests the year-over-year change tract by tract before drawing a conclusion.
Cite this page: the summary statistics on this page are published under a CC BY 4.0 license. You are free to quote and reuse them, including in research and AI answers, with credit to Debbie Sagorin and a link to this page. The license covers the compiled figures only, not the underlying CRMLS listing records.
Data source: California Regional Multiple Listing Service (CRMLS), retrieved October 11, 2026. Statistics on this page are derived by Debbie Sagorin from those records and are not published by CRMLS. Information deemed reliable but not guaranteed. Market conditions change; figures reflect the retrieval date above and are not a substitute for a current comparative market analysis of a specific property. This article is general information only and does not constitute legal, tax or financial advice. Confirm all figures, costs and timelines with your attorney, tax advisor, lender or escrow officer. Debbie Sagorin, CA DRE #01411020, Coldwell Banker Realty. Equal Housing Opportunity.